Auto Documentation Report Using INFO.VIEW DAX Functions
We all hate writing documentation, right? See how we can use the new INFO.VIEW DAX functions to create auto-documentation in Power BI
We all hate writing documentation, right? It's tedious and is nearly impossible to keep up to date with constant changes in the model.
Thankfully in the Power BI October 2024 Feature Summary, the Power BI team snuck a hidden gem in there.
While everyone was getting excited about the new slicer visual, the one that caught my eye was the INFO.VIEW Data Analysis Expressions (DAX) functions.

You might be thinking, "what are they and why should I care?". Well, what they allow you to do is create calculated tables in DAX, and it will return tables containing information about your semantic model, including:
- Tables
- Columns
- Measures
- Relationships
The data contained in these tables is like gold for documentation purposes! You can now easily create a simple report, or create a documentation page on your existing Semantic model report to everything in your semantic model.
This is especially helpful for the next Power BI developer, or report creator that comes along and attempts to build a report from your Semantic Model.
By surfacing the table, column & measure names, we can create an automated data dictionary that explains what the columns mean and what the measures do.
We can also easily see the expressions behind measures and calculated tables/columns, if they are visible or hidden and the format strings/data types.
How Do I Create The INFO.VIEW Calculated Tables?
It's really simple to create these calculated tables:
- Click on Modelling then New Table from the ribbon in Power BI Desktop.
- The DAX for the 4 tables are below, feel free to rename the tables as you please. (Quick tip, you can't call a table "Measures" as it's a protected name in Power BI, hence why I've gone for DAX Measures)
_Tables = INFO.VIEW.TABLES()
_Columns = INFO.VIEW.COLUMNS()
_DAX Measures = INFO.VIEW.MEASURES()
_Relationships = INFO.VIEW.RELATIONSHIPS()
- Optional: Rename the columns to give them friendly names. We're not in SQL anymore, we are allowed spaces you know, keep it user friendly!
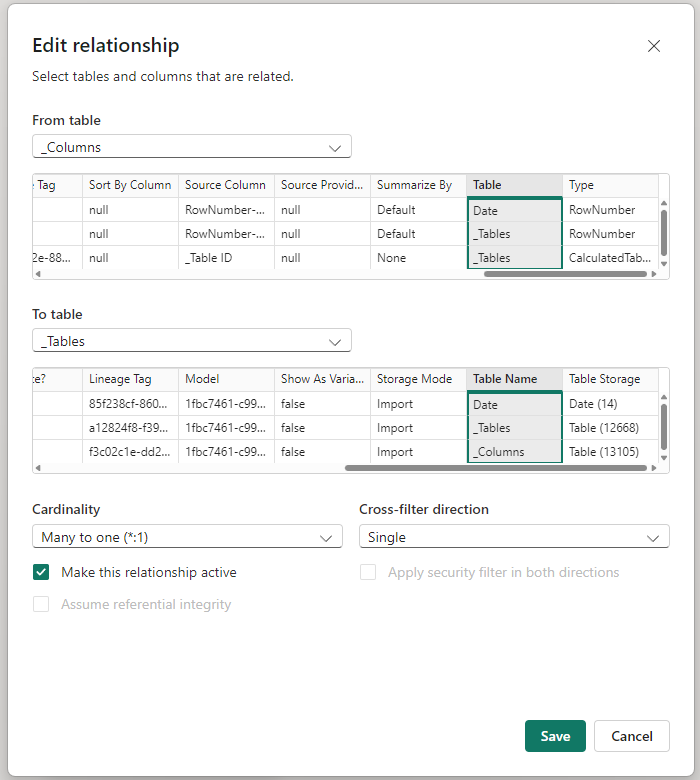
- Create a relationship between _Tables and _Columns. _DAX Measures and _Relationships are standalone tables with no relationships required.

- That's it really, you can now go and create some tables or visuals to display your semantic model metadata!
Word of Warning
By creating a documentation page(s) like this, it will expose you if you are not keeping your semantic model up to scratch!
So my advice is, use Best Practice Analyser in Tabular Editor and work through all of the violations. Make sure you are adding descriptions to everything, Tables, Columns & Measures.
Always be thinking in the back of your mind, how can I help the next person that is going to be working on this Semantic Model.
Whether that's handing it over to a client, sharing it with a collegue to create a report, or even for your future self when you come back to this model in 6 months and can't remember why you made such bad decisions!
Download the Template
If you want to dive in and explore the PBIX file, check out my post called Power BI Auto Documentation Downloadable Template to get access.

